Passive sensing, patented from antenna to algorithm.
Our sensors listen for the location-service signals that mobile phones already emit. No camera. No transmission. No personal information — ever. Here’s how it stacks up against everything else on the market.
DFRC vs. WiFi APs, cameras, mobile apps.
Every footfall-measurement technology has trade-offs. Here’s the honest one.
| DFRC IoT sensors | WiFi access points | Counters & cameras | Mobile app location | |
|---|---|---|---|---|
| Hardware | Required | Required | Required | None |
| Software | Dashboard, API, App | Dashboard, API, App | Dashboard, API, App | CSV exports |
| Data ownership | Exclusive | Exclusive | Exclusive | Shared |
| Accuracy | 90% minimum | Less accurate* | Less accurate, needs reboot | Accurate when app is active |
| Counting method | Mobile phone signals | Mobile phone signals | People | Mobile app data |
| Range | Up to 100 m | Varies | Gate or line of sight | Unlimited |
| Limitation | Mobile device required | Mobile device required | Environment dependent | Privacy & user consent required |
* Solutions based on access points listen to a single WiFi band — while solutions based on Software-Defined Radio (such as DFRC’s) listen to all bands. Access-point solutions therefore miss passers-by who only linger briefly.
11× patented, from how we sense to how we store.
Detection is built on a Software-Defined Radio listening passively to probing signals used for location services. No personal information is collected. No content of devices is read.
Our patented scanning algorithm detects up to 300% more devices than competing sensors, and uniquely identifies each one so the same phone is never double-counted.
No transmission
Sensors only listen. They generate no electromagnetic transmission and never touch device content.
One-way MAC hashing
A patented one-way encryption ingests every MAC address. The original address cannot be recovered.
PDPA / PIPA / GDPR ready
In SG & KR, encrypted MACs without auxiliary data are not personal data. In the EU, processing happens on-sensor — only aggregated results leave the device.
De-randomisation, solved.
iOS and Android rotate MAC addresses every second to hide identity — making one phone look like five different devices. Solutions that use a fixed ratio between randomised and non-randomised addresses are not accurate (the ratio is location and time-dependent). We reconcile them back into one.
Four sensor variants. One platform.
Static or moving, indoor or outdoor, mains-powered or solar-powered. Singapore deployments use a sensor we designed specifically for the climate, with the modem built into the plastic case.
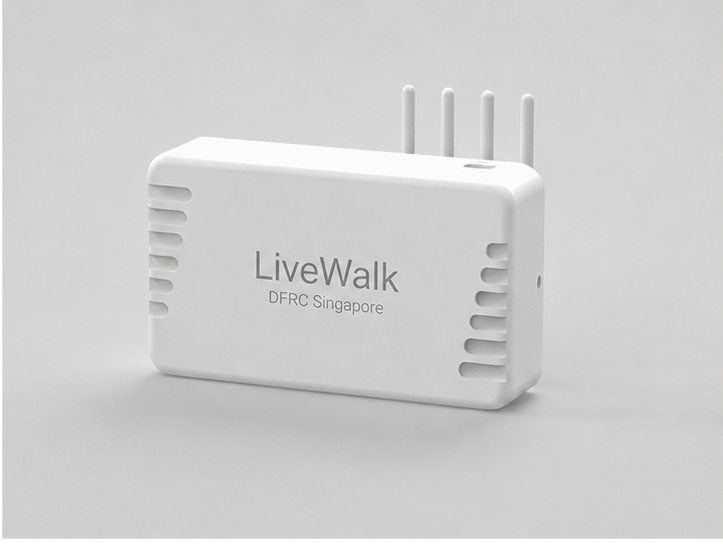
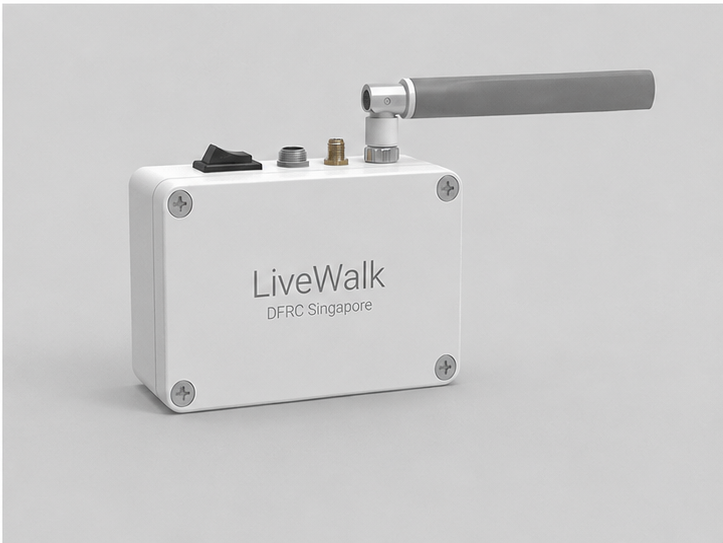
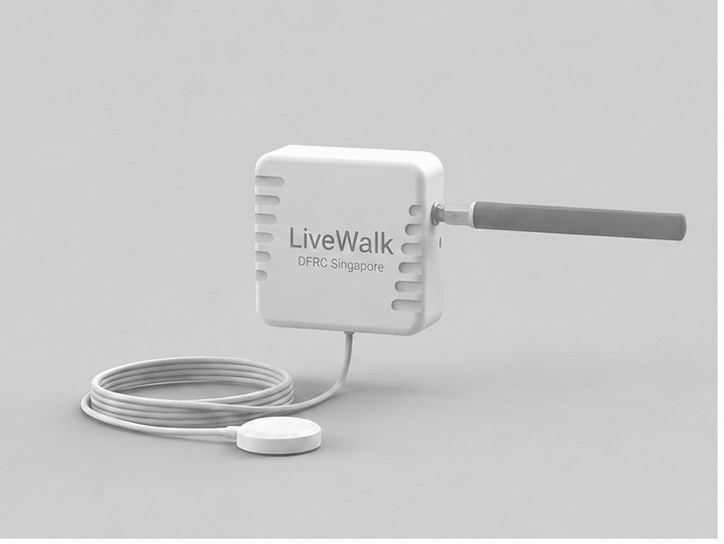
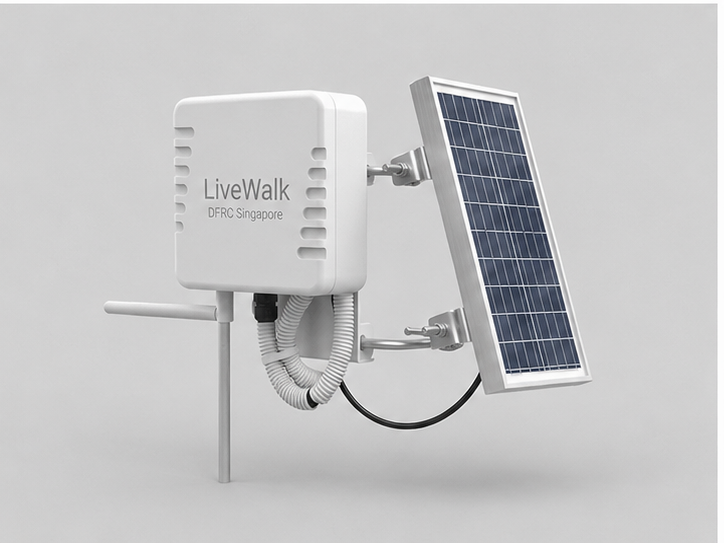
A working preview, not a screenshot.
Click through the modules in the sidebar. Switch sites in the top bar. Toggle the heatmap. The data is illustrative — the interactions are real.
The Dashboard lets you fetch data in real time, wherever you are, whenever you need it · nine modules covering site overview, mapping, heatmap, mobility, analytics, asset tracking, alerts and (D)OOH valuation.
Nine modules. One workspace.
The interactive preview is best on a wider screen — here’s what the Dashboard covers. Switch sites, toggle the heatmap, set alert thresholds, value (D)OOH inventory: it’s the same data your team would see in production, in real time.
Site overview
KPIs, hourly footfall, returning visitors and dwell distribution at a glance.
Insights map
Filter by region and date, then read footfall on top of a stylised basemap.
Heatmap
Density per square metre, updated every second.
Mobility
Top visitor paths between zones, with arrowed flow overlays on the map.
Analytics
Visitor counts and dwell over time with prediction bands.
Asset tracking
Locate tagged assets and surface anomalies (missing tags, distance shifts).
Alerts
Threshold rules per region (crowding, dwell, missing assets) with severity tiers.
Hourly valuation
Estimated transaction value per hour, by day — useful for billboard pricing.
Property valuation
Per-region revenue contribution and ranking for (D)OOH inventory.
Open the page on a laptop to try the interactive preview · or scroll on for the API alternative.
Or skip the dashboard and bring the data to where you work.
Three endpoints cover most use cases: Floating Population (real-time count), Visitor Count (historical count), and Sensor Health.
Integrate in an afternoon.
Bearer-token auth, per-region or aggregate queries, second-level resolution. Drop it into Grafana, Tableau, Power BI or your custom dashboard.
- → GET /floating-population — real-time count
- → GET /visitor-count — historical count by region
- → GET /sensor-health — per-sensor status
See where this is already running.
Singapore, Korea, Bangkok, Barcelona, Saudi Arabia, Australia — 59 cities, 4 continents, more than 5,200 sensors in the ground.
Browse deployments →